Data vs. Statistics
What is the difference between Data and Statistics?
Data is the raw information from which statistics are created.
Statistics provide an interpretation and summary of data.
Data
- Datasets
- Machine-readable data files, data files for statistical software programs
If you want to understand a phenomenon, you want data. Data can be analyzed and interpreted using statistical procedures to answer “why” or “how.” Data is used to create new information and knowledge.
Raw data is the direct result of research that was conducted as part of a study or survey. It is a primary source. It usually comes in the form of a digital data set that can be analyzed using software such as Excel, SPSS, SAS, and so on. This is what a data set looks like:
Statistics
- Statistical tables, charts, and graphs
- Reported numbers and percentages in an article
If you’re looking for a quick number, you want a statistic. A statistic will answer “how much” or “how many”. A statistic repeats a pre-defined observation about reality.
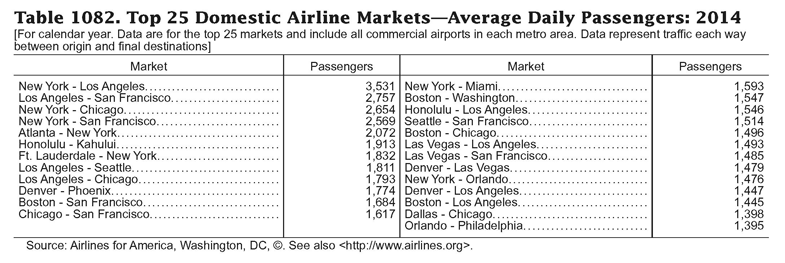
Statistics are the results of data analysis. It usually comes in the form of a table or chart. This is what a statistical table looks like:

Finding Data
Define your topic
Be specific about your topic so that you can narrow your search, but be flexible enough to tailor your needs to existing sources.
Identify the Unit of Analysis
You should be able to define the following:
Who or What?
Social Unit: This is the population that you want to study.
It can be...
- People
For example: individuals, couples, households - Organizations and Institutions
For example: companies, political parties, nation states - Commodities and Things
For example: crops, automobiles, arrests
When?
Time: This is the period of time you want to study.
Things to think about...
- Point in time
A "snapshot" or one-time study - Time Series
Study changes over time - Current information
Keep in mind that there is usually a time lag before data will be published. The most current information available may be a couple years old. - Historical information
Where?
Space: Geography or place.
There are two main types of geographic classifications...
- Political boundaries
For example: nation, state, county, school district, etc. - Statistical/census geography
For example: metropolitian statistical areas, tracts, block groups, etc.
Remember to define your topic with enough flexibility to adapt to available data!
Data is not available for every thinkable topic. Some data is private, must be purchased, uncollected, or unavailable. Be prepared to try alternative data.
- Finding Data Sources presentationShort presentation on data sources highlighting a few open and subscription sources.
Finding Statistics
What is your time frame and geography?
Time: Are you looking for information about a single point in time? Do you want to look at changes over time? Do you need historical information? Current information?
Be prepared that the most current statistics may actually be a year or more old. There can be multiple year lags before some information is released depending on how often the information is collected, the time it takes to process and crunch numbers, and the public release schedule.
Geography: Geographical areas can be defined by political boundaries (nations, states, counties, cities) or statistical boundaries (mainly Census geography such as metropolitian statistical areas, block groups, or tracts).
Who might collect the data? Who might publish the statistics?
These are some of the main types of producers of statistical information:
Government Agencies
- The government collects data to aid in policy decisions and is the largest producer of statistics overall. For example, the U.S. Census Bureau, Federal Election Commission, Federal Highway Administration and many other agencies collect and publish data. To better understand the structure of government agencies read the U.S. Government Manual and browse FedStats. Government statistics are free and publicly available, but may require access through library resources.
Non-Government Organizations
- Many independent non-commercial and nonprofit organizations collect and publish statistics that support their social platform. For example, the International Monetary Fund, United Nations, World Health Organization, and many others collect and publish statistics.
Academic Institutions
- Academic research projects funded by public and private foundations create a wealth of data. For example, the Michigan State of the State Survey and many other research projects publish statistics based on their data collection projects. Some statistical publications are available freely online, but others may require access through library resources.
Private Sector
- Commercial firms collect and publish data and statistics as a paid service to clients or to sell broadly. Examples include marketing firms, pollsters, trade organizations, and business information. This information is almost always is fee-based and may not always be available for public release. The library does subscribe to some commercial data services, particularly through the business library
What is the likelihood that the statistics will be made readily available?
It is good to keep in mind when doing research that some data and statistics might not be available. Some data is not collected and some might be held privately. Look for statistics reported in journal, news, and magazine articles. If they report a source, be sure to follow it to the source. By searching periodical indexes, you can often determine if anyone has conducted research into your area of inquiry. You may turn up a journal article with statistical tables on your topic, or you may find out that you have chosen such a unique topic that little to no research exists in that area. Maybe you can be flexible with your topic and find a similar substitute.