This page offers you some useful guiding questions to help you get started with research.
Remember to define your topic with enough flexibility to adapt to available data! Data is not available for every thinkable topic. Some data is private, must be purchased, uncollected, or unavailable. Be prepared to try alternative data.
Data is the raw information that is collected and/or recorded. Statistics is an interpretation and summary of data. In other words, statistics are used to provide meaningful conclusions about data.
If you want to understand a phenomenon, you want data. Data is used to create new information and knowledge. Raw data is the direct result of research, such as facts from a study or survey. It is a primary source. It usually comes in the form of a digital data set that can be analyzed using software such as Excel, SPSS, SAS, and so on.
Examples: Datasets, machine-readable data files, data files for statistical software programs
This is what a data set looks like:
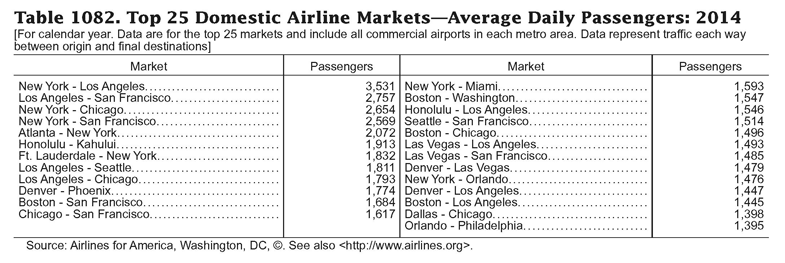
If you want to interpret a conclusion from the raw data about a phenomenon, you are using statistics. Statistical procedures often answer "why" or "how" from data. In other words, a statistic repeats a pre-defined observation about reality.
Examples: Statistical tables, charts, and graphs; Reported numbers and percentages in an article
This is what a statistical table looks like:

